Performance comparison between beluga_amcl and nav2_amcl
Environment details
CPU: Intel(R) Core(TM) i9-9900 CPU @ 3.10GHz x 16 cores
CPU Caches: L1 Data 32 KiB (x8), L1 Instruction 32 KiB (x8), L2 Unified 256 KiB (x8), L3 Unified 16384 KiB (x1)
RAM: 16384 MB
Host OS: Ubuntu 22.04.6 LTS
ROS 2 version: Humble Hawksbill
AMCL version:
ros-humble-nav2-amclpackage, version 1.1.9-1jammy.20230807.174459
Experimental setup
The following configuration was used during the experiments:
The benchmarks were run using 250, 300, 400, 500, 750, 1000, 2000, 5000, 10000, 20000, 50000, 100000 and 200000 particles.
beluga_amclwas run both using multi-threaded (par) and single-threaded (seq) configurations.nav2_amclonly provides single-threaded execution.Both the
beam sensorand thelikelihood fieldsensor model were tested.The bagfile containing the synthetic dataset was replayed at 1x speed (real time).
More specific configuration details can be found in the yaml files in the baseline_configurations/ folder:
nav2_amcl(likelihood field) uses likelihood_params.yamlbeluga_amcl(likelihood field, single-threaded) uses likelihood_params.yamlbeluga_amcl(likelihood field, multi-threaded) uses likelihood_params_par.yamlnav2_amcl(beam) uses beam_params.yamlbeluga_amcl(beam, single-threaded) uses beam_params.yamlbeluga_amcl(beam, multi-threaded) uses beam_params_par.yaml
Except for the multithreading and sensor model parameters, the configuration on all of the files is identical.
Recorded metrics
The following metrics were recorded during each run:
RSS (Resident Set Size), amount of memory alloated to the process. Measured in megabytes.
CPU usage. Measured in percentage of the total CPU usage.
rms APE (root-mean-squared Absolute Pose Error) statistics. In meters.
Processing latency (time interval between laser-scan reception and pose estimation). Measured in milliseconds.
The processing latency was only recorded for beluga_amcl. The unmodified nav2_amcl binary does not provide this metric in the process output.
Results
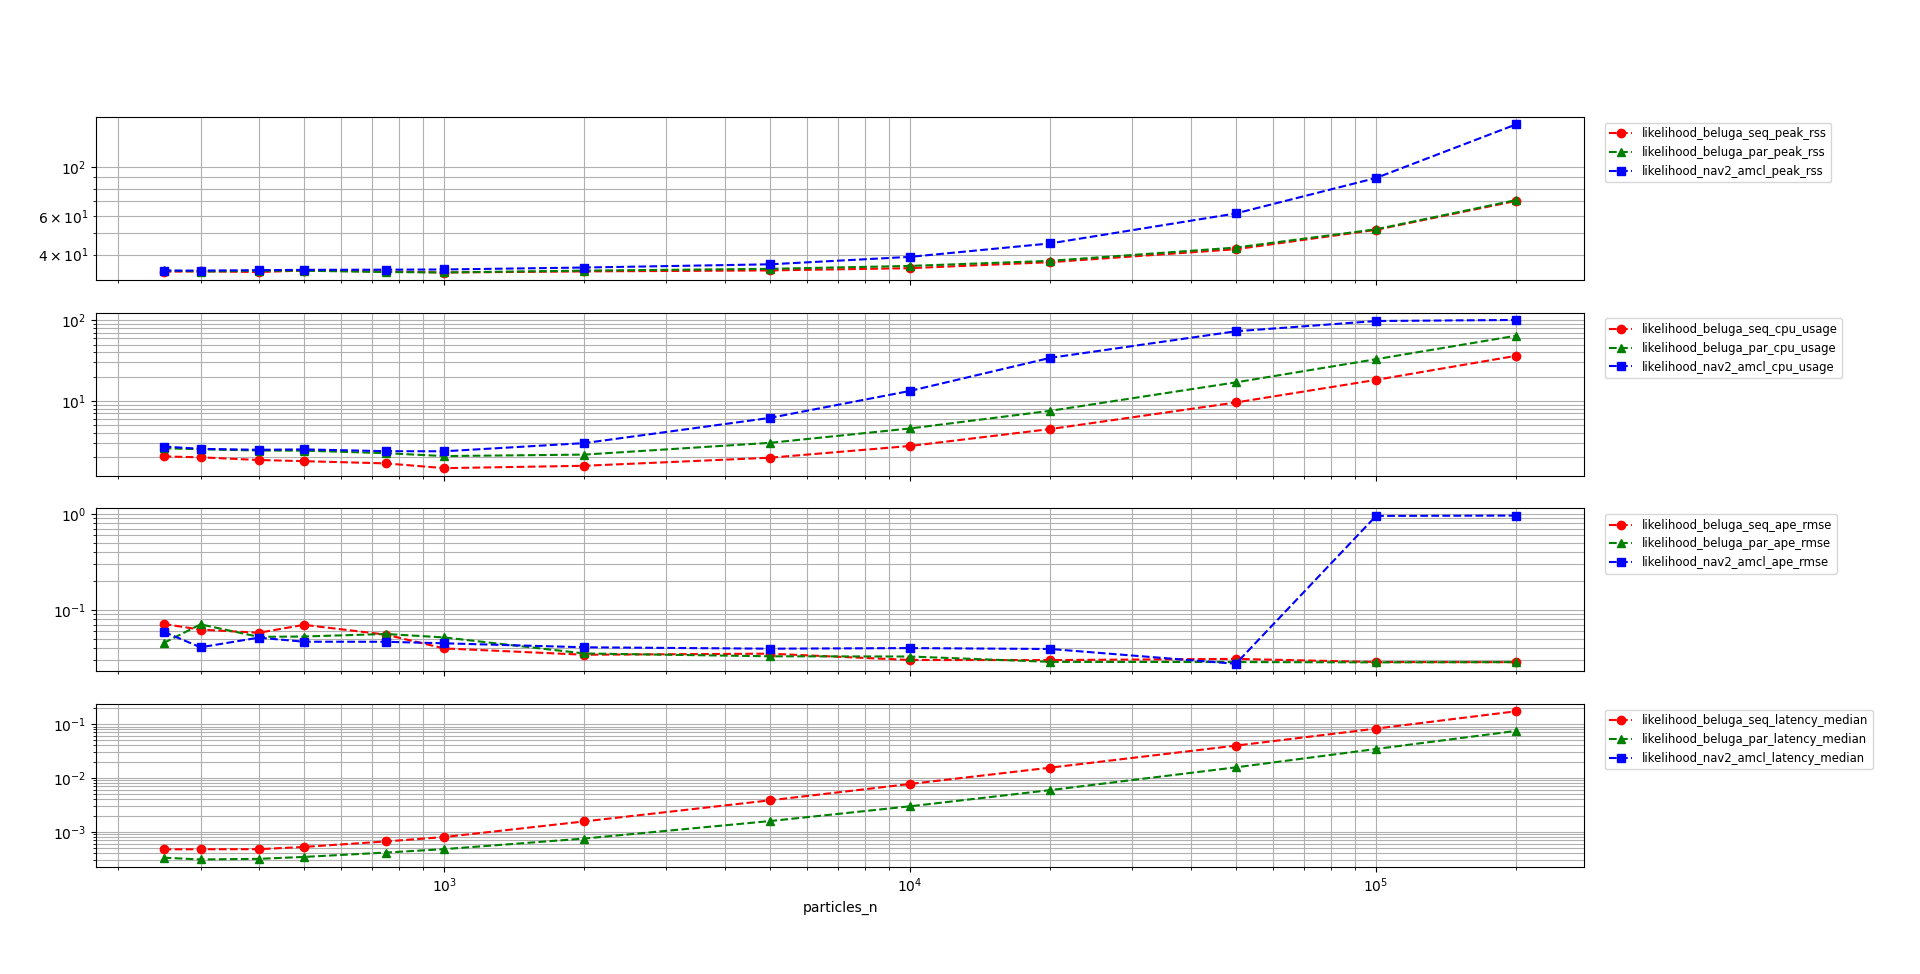
Beluga vs. Nav2 AMCL using Likelihood Field sensor model
In the following plot the results of the benchmark are shown for all three of the tested alternatives. The vertical scale is logarithmic to better show the differences between the configurations throughout the whole range of particle counts.
Comments on the results:
The memory usage of
beluga_amcl(single and multi-threaded) is significantly lower than that ofnav2_amcl.Both
beluga_amclconfigurations have a lower CPU load thannav2_amclwhen using thelikelihoodsensor model. The multi-threaded configuration ofbeluga_amclcauses more CPU load than the single-threaded one due to the additional synchronization overhead.Above $50k$ particles
nav2_amclsingle-threaded process begins to saturate the CPU and its APE metrics begin to deteriorate, whilebeluga_amclin both configurations remains stable thanks to its lower CPU load. For particle counts below $50k$ the APE metrics of all three alternatives are similar.The multi-threaded configuration of
beluga_amclhas lower latency than the single-threaded one, at the expense of additional CPU load. The latency ofnav2_amclwas not measured for the reasons explained above.
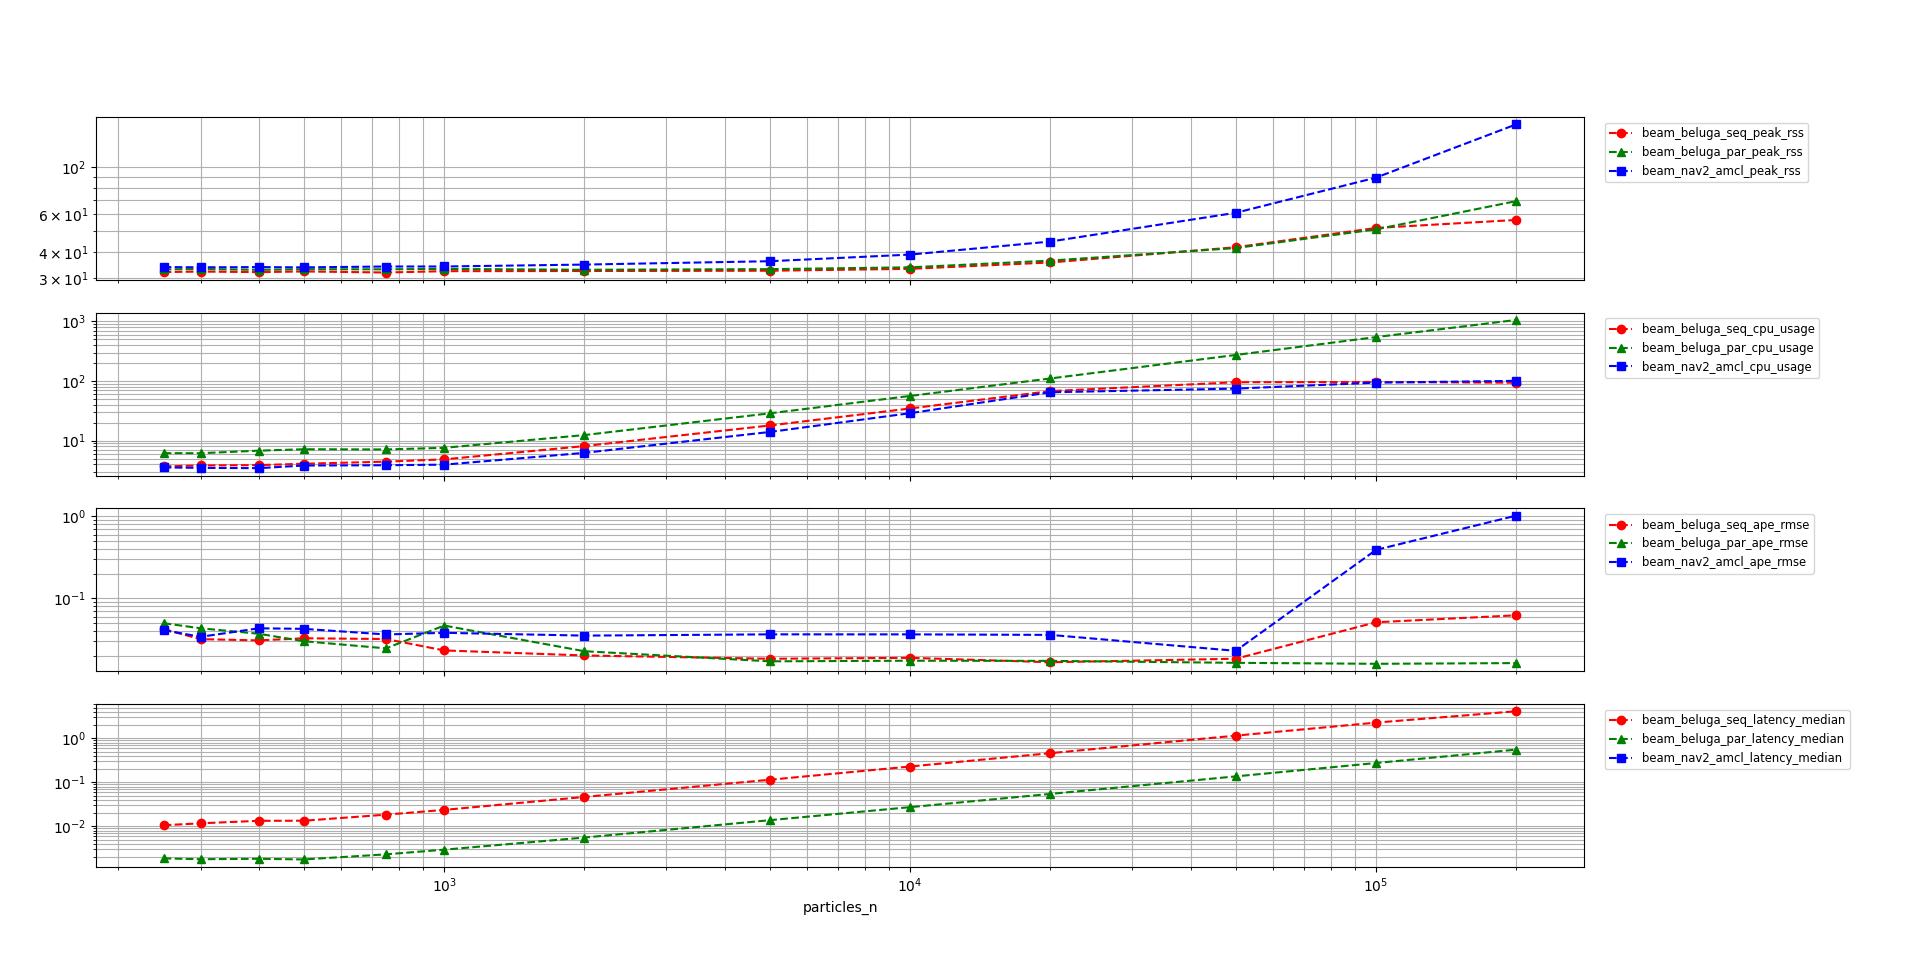
Beluga vs. Nav2 AMCL using Beam sensor model
In the following plot the results of the benchmark are shown for all three of the tested configurations when using the Beam Sensor model. The vertical scale is logarithmic to better show the differences between the configurations throughout the whole range of particle counts.
Comments on the results:
beluga_amclin both multi-threaded and single-threaded configurations uses significantly less memory thannav2_amcl.Both the single-threaded configuration of
beluga_amclandnav2_amclhave similar CPU load performance when using thebeamsensor model. The multi-threaded configuration ofbeluga_amcluses more CPU than the single-threaded one due to the additional synchronization overhead.Above $50k$ particles both
nav2_amcland the single-threaded configuration ofbeluga_amclbegin to saturate the CPU and their APE metrics begin to deteriorate, whilebeluga_amclin multi-threaded configuration remains stable. For particle counts below $50k$ the APE metrics of all three alternatives are similar.The multi-threaded configuration of
beluga_amclhas lower latency than the single-threaded one, at the expense of additional CPU load. The latency ofnav2_amclwas not measured for the reasons explained above.
Conclusions
beluga_amcl’s memory usage is significantly lower than that ofnav2_amclin all configurations.The single-threaded configuration of
beluga_amclperforms at a lower or equal CPU load than that ofnav2_amcl. When configured to use thelikelihoodsensor model the performance of the single-threadedbeluga_amclconfiguration is significantly better than that ofnav2_amcl.The multi-threaded configuration of
beluga_amclalways uses more CPU than the single-threaded configuration.beluga_amcl’s APE performance is similar to that ofnav2_amclfor lower particle counts. For higher particle counts the performance begins to deteriorate when the processes saturate the available CPU resources.The multi-threaded configuration of
beluga_amclhas lower latency than the single-threaded one, at the expense of additional CPU load. Also, Thanks to the reduced latency and higher CPU saturation ceiling the localization solution usingbeluga_amclin multi-threaded configuration remains stable for higher particle counts.
How to reproduce
To replicate the benchmarks, after building and sourcing the workspace, run the following commands from the current directory:
mkdir beam_beluga_seq
cd beam_beluga_seq
ros2 run beluga_benchmark parameterized_run --initial-pose-y 2.0 250 300 400 500 750 1000 2000 5000 10000 20000 50000 100000 200000  --params-file $(pwd)/../../baseline_configurations/beam_params.yaml
cd -
mkdir beam_beluga_par
cd beam_beluga_par
ros2 run beluga_benchmark parameterized_run --initial-pose-y 2.0 250 300 400 500 750 1000 2000 5000 10000 20000 50000 100000 200000  --params-file $(pwd)/../../baseline_configurations/beam_params_par.yaml
cd -
mkdir beam_nav2_amcl
cd beam_nav2_amcl
ros2 run beluga_benchmark parameterized_run --initial-pose-y 2.0 250 300 400 500 750 1000 2000 5000 10000 20000 50000 100000 200000 --params-file $(pwd)/../../baseline_configurations/beam_params.yaml --package nav2_amcl --executable amcl
cd -
mkdir likelihood_beluga_seq
cd likelihood_beluga_seq
ros2 run beluga_benchmark parameterized_run --initial-pose-y 2.0 250 300 400 500 750 1000 2000 5000 10000 20000 50000 100000 200000  --params-file $(pwd)/../../baseline_configurations/likelihood_params.yaml
cd -
mkdir likelihood_beluga_par
cd likelihood_beluga_par
ros2 run beluga_benchmark parameterized_run --initial-pose-y 2.0 250 300 400 500 750 1000 2000 5000 10000 20000 50000 100000 200000  --params-file $(pwd)/../../baseline_configurations/likelihood_params_par.yaml
cd -
mkdir likelihood_nav2_amcl
cd likelihood_nav2_amcl
ros2 run beluga_benchmark parameterized_run --initial-pose-y 2.0 250 300 400 500 750 1000 2000 5000 10000 20000 50000 100000 200000 --params-file $(pwd)/../../baseline_configurations/likelihood_params.yaml --package nav2_amcl --executable amcl
cd -
Once the data has been acquired, it can be visualized using the following commands:
ros2 run beluga_benchmark compare_results \
    -s beam_beluga_seq -l beam_beluga_seq \
    -s beam_beluga_par -l beam_beluga_par \
    -s beam_nav2_amcl  -l beam_nav2_amcl --use-ylog

ros2 run beluga_benchmark compare_results \
    -s likelihood_beluga_seq -l likelihood_beluga_seq \
    -s likelihood_beluga_par -l likelihood_beluga_par \
    -s likelihood_nav2_amcl  -l likelihood_nav2_amcl --use-ylog