Performance comparison between beluga_amcl and nav2_amcl
Environment details
CPU: Intel(R) Core(TM) i9-9900 CPU @ 3.10GHz x 16 cores
CPU Caches: L1 Data 32 KiB (x8), L1 Instruction 32 KiB (x8), L2 Unified 256 KiB (x8), L3 Unified 16384 KiB (x1)
RAM: 16384 MB
Host OS: Ubuntu 22.04.6 LTS
Commit hash: 9f003ee4855072ef78d58f91ecc1a3a423cac319
Experimental setup
The following configuration was used during the experiments:
The benchmarks were run using 250, 300, 400, 500, 750, 1000, 2000, 5000, 10000, 20000, 50000, 100000 and 200000 particles.
beluga_amclwas run both using multithreaded and non-multithreaded configurations.nav2_amclonly provides non-multithreaded execution.Both the
beam sensorand thelikelihood fieldsensor model were tested.The bagfile containing the synthetic dataset was replayed at 1x speed (real time).
More specific configuration details can be found in the params.yaml files:
nav2_amcl(likelihood field) uses likelihood_params.yamlbeluga_amcl(likelihood field, non-multithreaded) uses likelihood_params.yamlbeluga_amcl(likelihood field, multithreaded) uses likelihood_params_par.yamlnav2_amcl(beam) uses beam_params.yamlbeluga_amcl(beam, non-multithreaded) uses beam_params.yamlbeluga_amcl(beam, multithreaded) uses beam_params_par.yaml
Except for the multithreading and sensor model parameters, the configuration on all of the files is identical.
Recorded metrics
The following metrics were recorded during each run:
RSS (Resident Set Size), amount of memory occupied by a process that is held in RAM.
CPU usage.
APE (Absolute Pose Error) statistics:
mean,median,maxandrmse.
Results
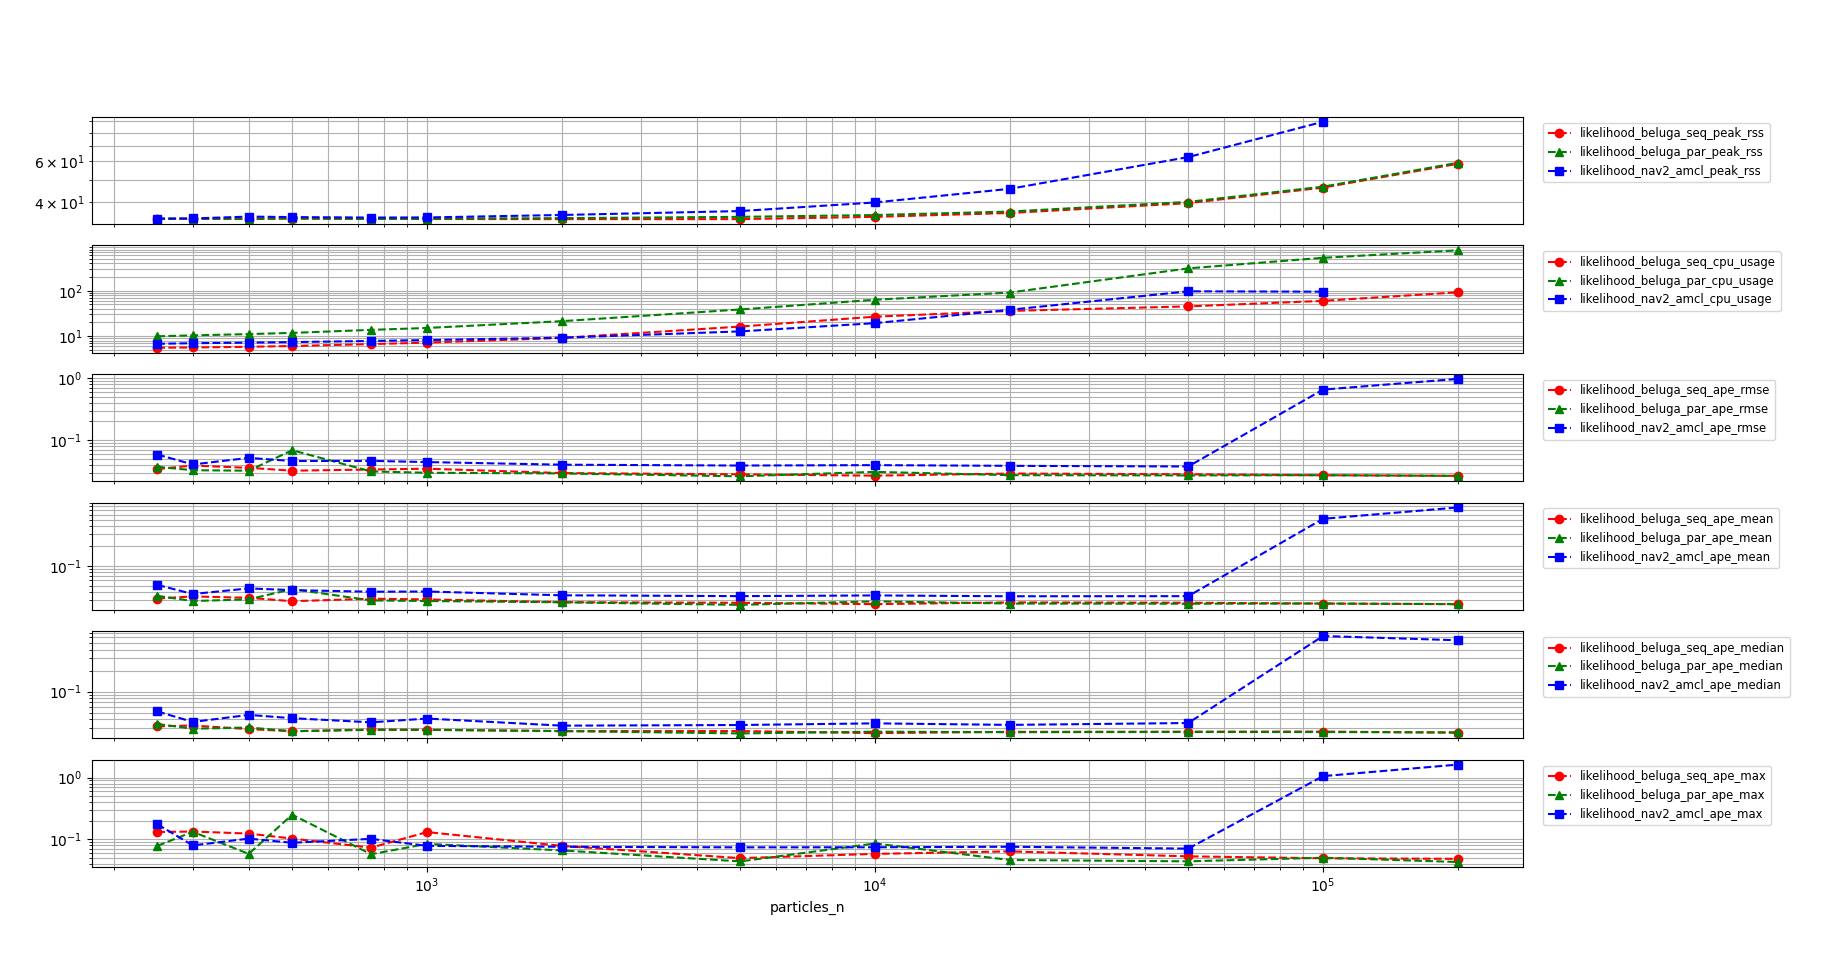
Beluga vs. Nav2 AMCL using Likelihood Field Sensor Model
In the following graph the results of the benchmark are shown for all three of the tested configurations. The vertical scale is logarithmic to better show the differences between the configurations throughout the whole range of particle counts.
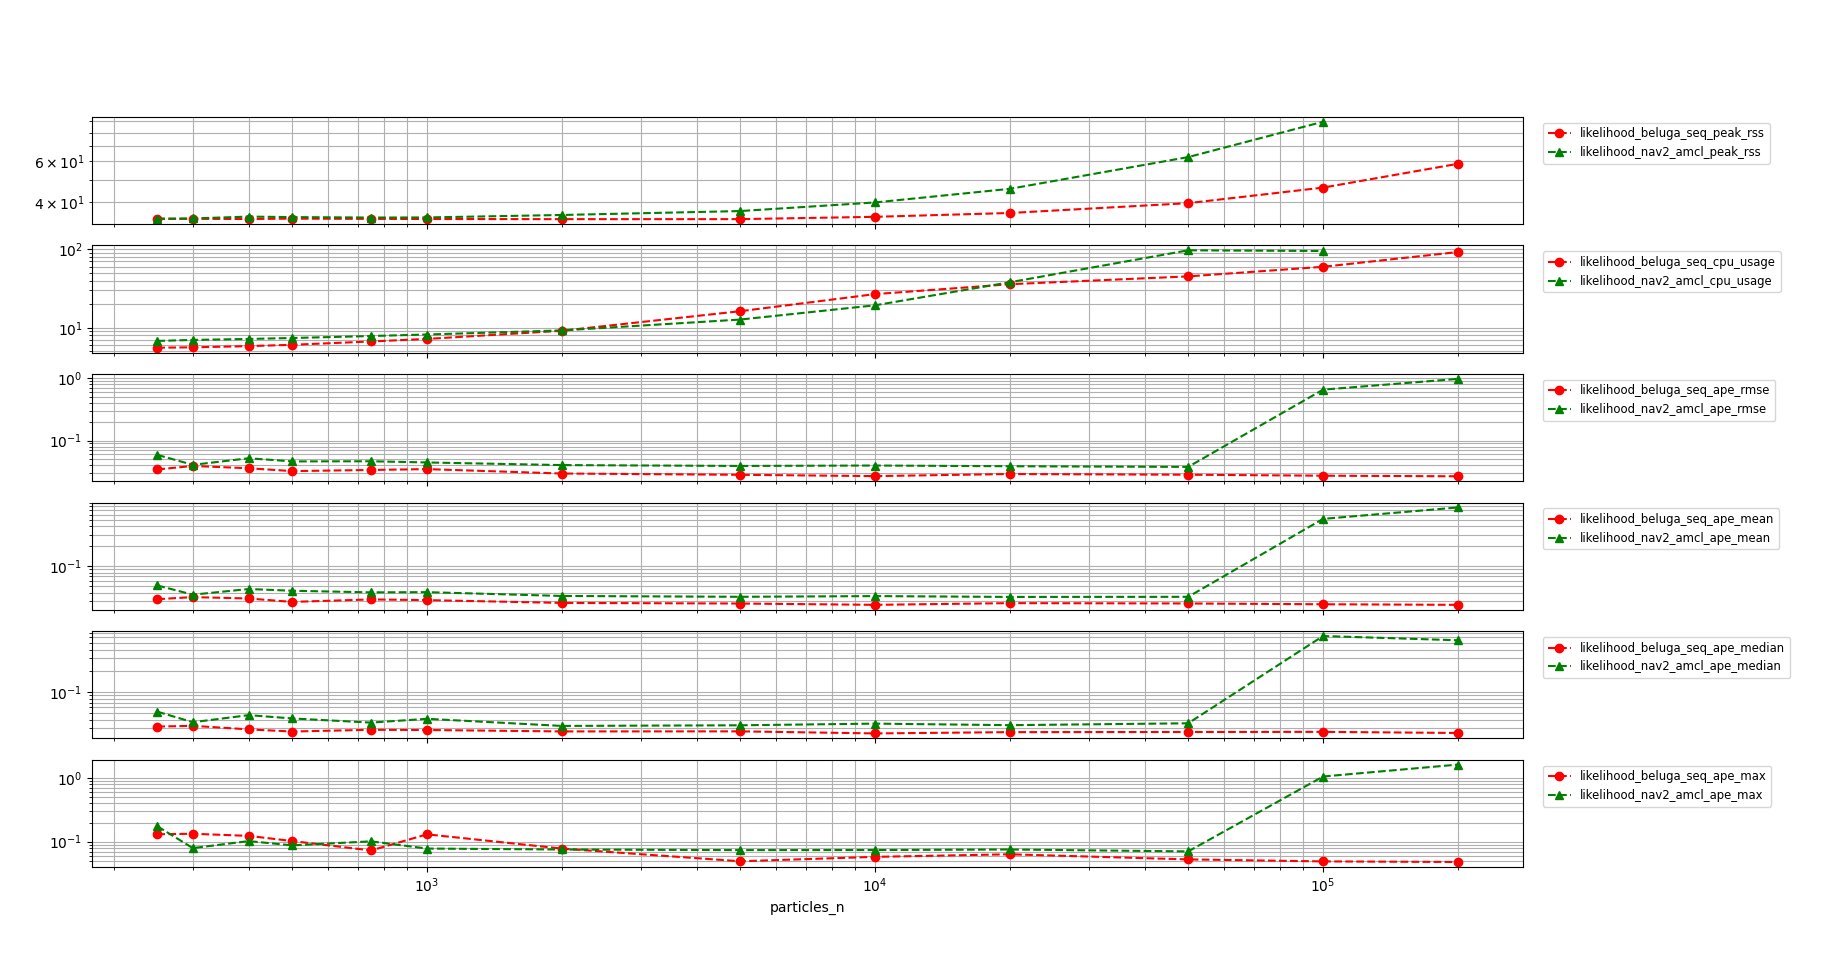
A closer detail of beluga_amcl in non-multithreaded configuration and nav2_amcl can be seen in the following graph:
Comments on the results:
The memory usage of
beluga_amcl(both configurations) is significantly lower than that ofnav2_amcl.The non-multithreaded
beluga_amclandnav2_amclperform similarly in terms of CPU usage.The multithreaded
beluga_amclCPU requirements are higher than both the non-multithreadedbeluga_amclandnav2_amcl.In the CPU saturation region,
nav2_amclAPE metrics begin to deteriorate significantly, whilebeluga_amcl’s remain stable. In the non-saturation region, the APE of bothbeluga_amclandnav2_amclis similar with a slight advantage for the former.
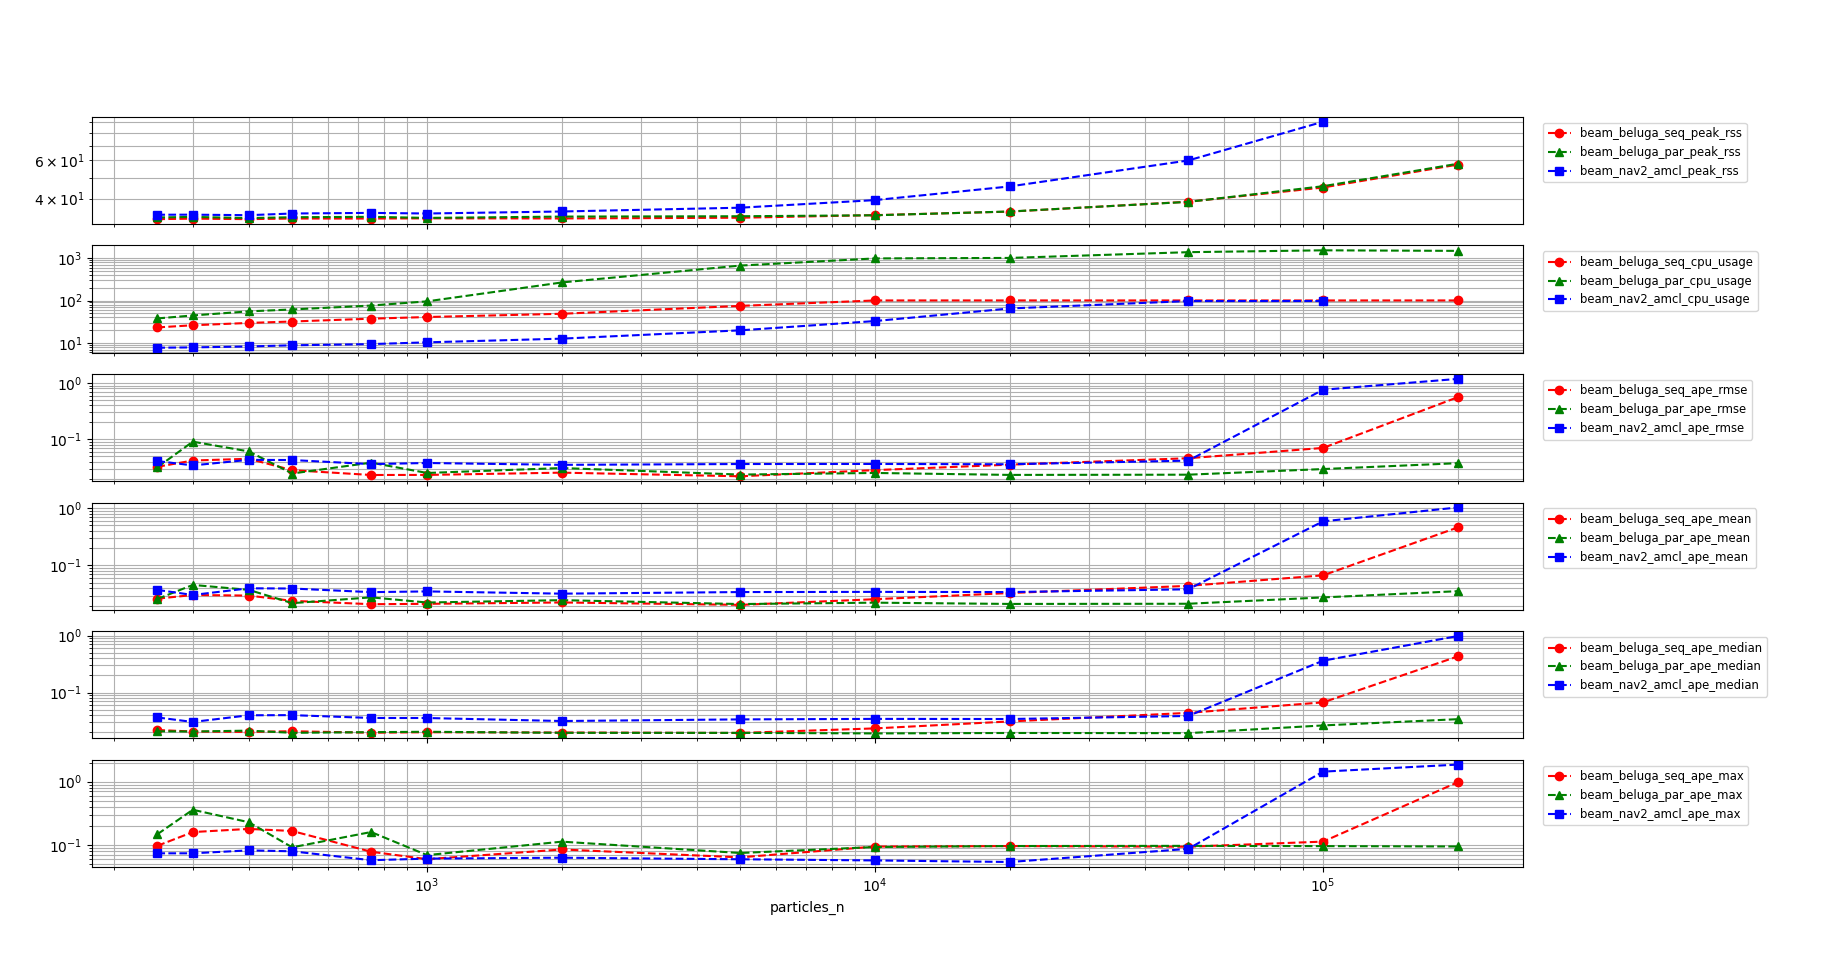
Non-multithreaded Beluga vs. Nav2 AMCL with Beam Sensor Model
In the following graph the results of the benchmark are shown for all three of the tested configurations when using the Beam Sensor model. The vertical scale is logarithmic to better show the differences between the configurations throughout the whole range of particle counts.
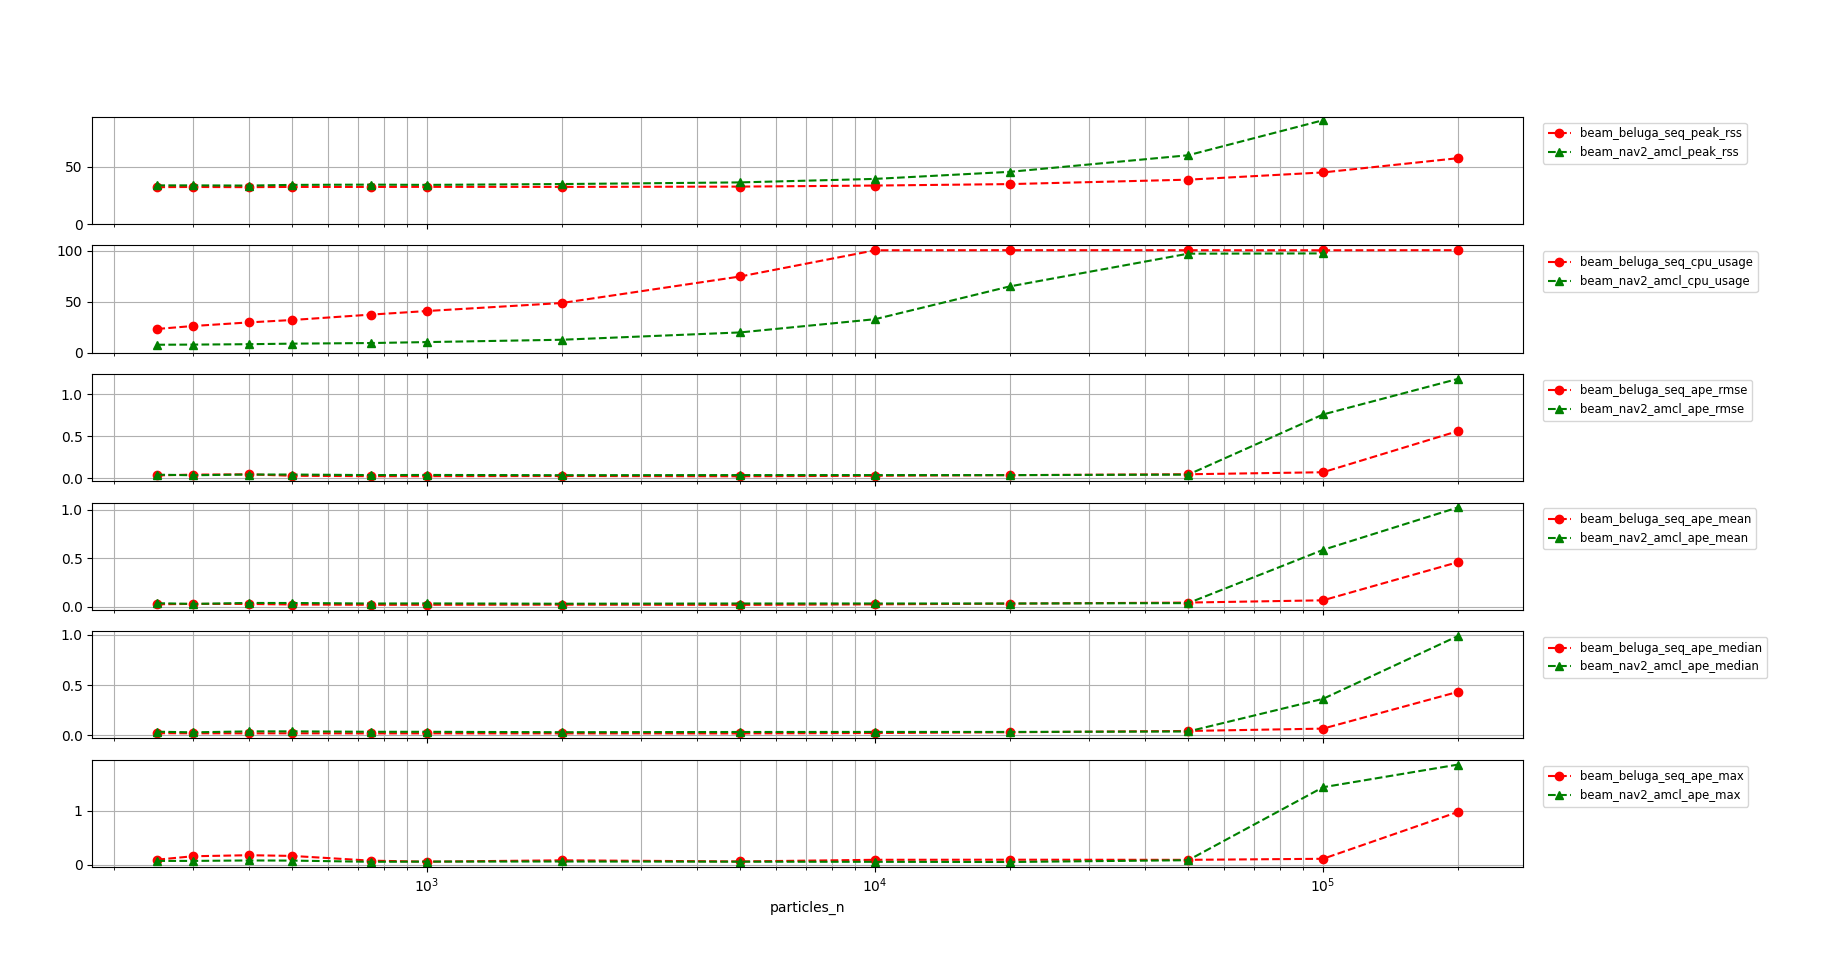
A closer detail of beluga_amcl in non-multithreaded configuration and nav2_amcl can be seen in the following graph:
Comments on the results:
beluga_amclin both multithreaded and non-multithreaded configurations uses significantly less memory thannav2_amcl.On the other hand, both
beluga_amclconfigurations use significantly more CPU thannav2_amclwhen using the Beam Sensor Model.The APE performance of both multithreaded and non-multithreaded
beluga_amclis similar to that ofnav2_amclthroughout the whole range of particle counts, with a slight advantage for the former.
Conclusions
beluga_amcl’s memory usage is significantly lower than that ofnav2_amclin all configurations.The Likelihood Field Sensor Model in beluga is about as efficient as that of
nav2_amclin terms of CPU usage.The Beam Sensor Model, on the other hand, still requires further optimization in order to be competitive with
nav2_amclin terms of CPU usage.In all configurations
beluga_amcl’s APE performance is similar to that ofnav2_amcl.
How to reproduce
To replicate the benchmarks, after building and sourcing the workspace, run the following commands from the current directory:
mkdir beam_beluga_seq
cd beam_beluga_seq
ros2 run beluga_benchmark parameterized_run --initial-pose-y 2.0 250 300 400 500 750 1000 2000 5000 10000 20000 50000 100000 200000  --params-file ../beam_params.yaml
cd -
mkdir beam_beluga_par
cd beam_beluga_par
ros2 run beluga_benchmark parameterized_run --initial-pose-y 2.0 250 300 400 500 750 1000 2000 5000 10000 20000 50000 100000 200000  --params-file ../beam_params_par.yaml
cd -
mkdir beam_nav2_amcl
cd beam_nav2_amcl
ros2 run beluga_benchmark parameterized_run --initial-pose-y 2.0 250 300 400 500 750 1000 2000 5000 10000 20000 50000 100000 200000 --params-file ../beam_params.yaml --package nav2_amcl --executable amcl
cd -
mkdir likelihood_beluga_seq
cd likelihood_beluga_seq
ros2 run beluga_benchmark parameterized_run --initial-pose-y 2.0 250 300 400 500 750 1000 2000 5000 10000 20000 50000 100000 200000  --params-file ../likelihood_params.yaml
cd -
mkdir likelihood_beluga_par
cd likelihood_beluga_par
ros2 run beluga_benchmark parameterized_run --initial-pose-y 2.0 250 300 400 500 750 1000 2000 5000 10000 20000 50000 100000 200000  --params-file ../likelihood_params_par.yaml
cd -
mkdir likelihood_nav2_amcl
cd likelihood_nav2_amcl
ros2 run beluga_benchmark parameterized_run --initial-pose-y 2.0 250 300 400 500 750 1000 2000 5000 10000 20000 50000 100000 200000 --params-file ../likelihood_params.yaml --package nav2_amcl --executable amcl
cd -
Once the data has been acquired, it can be visualized using the following commands:
ros2 run beluga_benchmark compare_results \
    -s beam_beluga_seq -l beam_beluga_seq \
    -s beam_beluga_par -l beam_beluga_par \
    -s beam_nav2_amcl  -l beam_nav2_amcl --use-ylog

ros2 run beluga_benchmark compare_results \
    -s beam_beluga_seq -l beam_beluga_seq \
    -s beam_nav2_amcl  -l beam_nav2_amcl --use-ylog

ros2 run beluga_benchmark compare_results \
    -s likelihood_beluga_seq -l likelihood_beluga_seq \
    -s likelihood_beluga_par -l likelihood_beluga_par \
    -s likelihood_nav2_amcl  -l likelihood_nav2_amcl --use-ylog

ros2 run beluga_benchmark compare_results \
    -s likelihood_beluga_seq -l likelihood_beluga_seq \
    -s likelihood_nav2_amcl  -l likelihood_nav2_amcl --use-ylog

ros2 run beluga_benchmark compare_results \
    -s lima_1/likelihood_beluga_seq -l before_likelihood_beluga_seq \
    -s lima_1/likelihood_beluga_par -l before_likelihood_beluga_par \
    -s lima_2/likelihood_beluga_seq -l after_likelihood_beluga_seq \
    -s lima_2/likelihood_beluga_par -l after_likelihood_beluga_par --use-ylog

ros2 run beluga_benchmark compare_results \
    -s lima_1/beam_beluga_seq -l before_beam_beluga_seq \
    -s lima_1/beam_beluga_par -l before_beam_beluga_par \
    -s lima_2/beam_beluga_seq -l after_beam_beluga_seq \
    -s lima_2/beam_beluga_par -l after_beam_beluga_par --use-ylog